Differential Gene Expression
I use this code to run DESeq2 for evey differential gene expression analysis I have:
library(DESeq2)
library(biomaRt)
library(DEGreport)
library(ggplot2)
library(dplyr)

# Load data
setwd('/home/<directory>')
cts <- read.delim('counts_data.csv', sep=',', header = TRUE, row.names = 1)
condition <- factor(c("Control", "Control", "Control", "Control", "Control", "Control", "Control", "Control", "Control", "Control", "Disease", "Disease", "Disease", "Disease", "Disease", "Disease", "Disease", "Disease", "Disease"))
coldata <- data.frame(row.names = colnames(cts), condition)
Groups <- make.names(c("Control", "Disease"))

keep <- rowSums(cts >= 10) >= min(table(coldata))
cts <- cts[keep, ]

dds <- DESeqDataSetFromMatrix(countData = round(cts),
                              colData = coldata,
                              design = ~condition)
dds <- DESeq(dds)

# Save all the results
res <- results(dds, contrast = c("condition", Groups[2], Groups[1]),
               alpha = 0.05,
               pAdjustMethod = "fdr")

res <- as.data.frame(res)
write.csv(res, 'all_results.csv')

# Filtered DEGs
res <- subset(res, padj < 0.01 & abs(log2FoldChange) > 1)
res <- res[order(res$log2FoldChange), ]
write.csv(res, 'deg_results.csv')

# Summary of DEGs
summary(res)

# Top 10 genes: downregulated and upregulated
up <- res[order(res$log2FoldChange)[1:10], ]
down <- res[order(-res$log2FoldChange)[1:10], ]
write.csv(up, 'DEG_top10_up.csv')
write.csv(down, 'DEG_top10_down.csv')
ENSEMBL IDs to Gene Symbols
Sometimes we have ENSEMBL IDs in the original counts matrix, but for plots and further analysis we need the official gene symbols. I use the bioMart package to convert:
gene_id <- rownames(res)

# Choose the database
ensemble <- useEnsembl(biomart='genes')
datasets <- listDatasets(ensemble)
# Select the species: Homo sapiens
ensemble <- useDataset(dataset="hsapiens_gene_ensembl", mart=ensemble)
attributes <- listAttributes(ensemble)
ensemble <- useEnsembl(biomart = "genes", dataset="hsapiens_gene_ensembl")
results <- getBM(mart=ensemble, attributes = "hgnc_symbol",
                 filters = "ensembl_gene_id",
                 values = gene_id)
# Get the corresponding gene symbols
gene_data <- getBM(attributes = c("ensembl_gene_id", "hgnc_symbol"),
                   filters = "ensembl_gene_id",
                   values = gene_id,
                   mart = ensemble)
# Create a dataframe with Ensembl IDs and gene symbols
genes <- data.frame(Ensembl_ID = gene_data$ensembl_gene_id,
                    Gene_Symbol = gene_data$hgnc_symbol)
# Gene symbols that are not found in the ensembl dataframe
not_found <- gene_data[gene_data$hgnc_symbol == "",]
cat("biomart couldn't find", length(rownames(not_found)), "of the genes!")

# Remove rows that have not been founded
genes <- genes[genes$Gene_Symbol != "",]
gene_symbols <- genes$Gene_Symbol
gene_ensmbl <- genes$Ensembl_ID
matching_genes <- res[rownames(res) %in% gene_ensmbl, ]
matching_log2foldchanges <- matching_genes$log2FoldChange
result_df <- data.frame(GeneSymbol = gene_symbols, log2FoldChange = matching_log2foldchanges)
write.csv(result_df, 'genes_log2.csv', row.names = FALSE)
Plots
#<<<<<<<<<<<<<<<<________PLOTS__________>>>>>>>>>>>>>>>>>>>>>>>#
# Important genes that we want to plot
imp_genes <- c("CDON", "OMG", "TSPAN15", "CHEK1", "ROBO2", "PGA5")
# Select the important genes from the dataframe
selected <- genes %>% filter(Gene_Symbol %in% imp_genes)
# Slice the rows (ensembl ids) to give them to the degPlot function so it plots the important genes
sel_rows <- selected[[1]]
png("./plots/table_log2fc_abundance_plot.png", width = 1500, height = 1500, res = 300)
degPlot(dds, genes = sel_rows, xs = "condition", group = "condition", color = "Accent")
dev.off()
png("./plots/deg_Plot_Wide.png", width = 1500, height = 1500, res = 300)
degPlotWide(dds, rownames(dds)[1:5], group="condition")
dev.off()
# Individual Gene Count
# Loop, find expression, plot, save png to folder
gene_ids_data <- read.csv("gene_ids_plot.csv")
gene_ids <- gene_ids_data$gene_id
gene_symbols <- gene_ids_data$gene_symbol # Assuming the column name is "gene_symbol"
## Loop through gene_ids and create plots
for (i in seq_along(gene_ids)) {
gene_id <- gene_ids[i]
gene_symbol <- gene_symbols[i]
# Create a plot
png_file <- file.path("./plots/", paste0(gene_symbol, "_plot.png")) # Generate the full file path
png(png_file, width = 800, height = 600) # Set width and height as needed
plotCounts(dds = dds, gene = gene_id, main = gene_symbol)
dev.off() # Close the PNG device
# Print a message to show progress
cat("Plot saved for gene:", gene_symbol, "\n")
}
# Dispersion
png("./plots/dispersion_plot.png", width = 1500, height = 1500, res = 300)
plotDispEsts(dds, main = "Dispersion Estimates")
dev.off()
# PCA
vsd <- vst(dds, blind=FALSE)
png("./plots/PCA_plot.png", width = 1500, height = 1500, res = 300)
plotPCA(vsd, intgroup = "condition")
dev.off()
# create histogram plot of p-values
png("./plots/Histo_P-values_plot.png", width = 1500, height = 1500, res = 300)
hist(res$padj, breaks=seq(0, 1, length = 21), col = "gray", border = "white",
xlab = "", ylab = "", main = "Frequencies of padj-values")
dev.off()
# volcano plot
png("./plots/Volcano_plot.png", width = 1500, height = 1500, res = 300)
old.pal <- palette(c("#00BFFF", "#FF3030")) # low-hi colors
par(mar=c(4,4,2,1), cex.main=1.5)
plot(res$log2FoldChange, -log10(res$padj), main=paste(Groups[1], "vs", Groups[2]),
xlab="log2FC", ylab="-log10(Padj)", pch=20, cex=0.5)
with(subset(res, padj<0.05 & abs(log2FoldChange) >= 0),
points(log2FoldChange, -log10(padj), pch=20, col=(sign(log2FoldChange) + 3)/2, cex=1))
legend("bottomleft", title=paste("Padj<", 0.05, sep=""), legend=c("down", "up"), pch=20,col=1:2)
dev.off()
# MD plot
png("./plots/MD_plot.png", width = 1500, height = 1500, res = 300)
par(mar=c(4,4,2,1), cex.main=1.5)
plot(log10(res$baseMean), res$log2FoldChange, main=paste(Groups[1], "vs", Groups[2]),
xlab="log10(mean of normalized counts)", ylab="log2FoldChange", pch=20, cex=0.5)
with(subset(res, padj<0.05 & abs(log2FoldChange) >= 0),
points(log10(baseMean), log2FoldChange, pch=20, col=(sign(log2FoldChange) + 3)/2, cex=1))
legend("bottomleft", title=paste("Padj<", 0.05, sep=""), legend=c("down", "up"), pch=20,col=1:2)
abline(h=0)
palette(old.pal) # restore palette
dev.off()
## 3. Heatmap: sample-to-sample distance
### Generate distance matrix
library(pheatmap)
library(RColorBrewer)
sampleDists <- dist(t(assay(vsd)))
sampleDistsMatrix <- as.matrix(sampleDists)
### Colorscheme
colors <- colorRampPalette(rev(brewer.pal(9,"Blues")))(255)
### Generate heatmap
png("./plots/Heatmap_Smp2Smp_Distance_plot.png", width = 1500, height = 1500, res = 300)
pheatmap(sampleDistsMatrix, clustering_distance_rows=sampleDists,
clustering_distance_cols=sampleDists, col=colors)
dev.off()
## 4. Heatmap of log transformed normal counts: top 10 genes.
top_genes <- res[order(res$padj), ][1:10,]
### Get the gene names for the top 10
top_genes <- row.names(top_genes)
### R log transformation
png("./plots/Heatmap_R_Log_Transformation_plot.png", width = 1500, height = 1500, res = 300)
rld <- rlog(dds, blind=FALSE)
pheatmap(assay(rld)[top_genes,], cluster_rows=FALSE, show_rowname=TRUE,cluster_cols=FALSE)
dev.off()
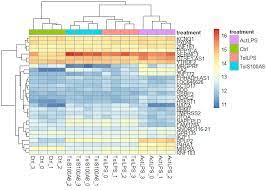
## 5. Heatmap of Z scores
normalized_counts <- counts(dds,normalized=TRUE)
write.csv(normalized_counts, 'normalized_counts.csv')
cal_z_score <- function(x) {(x-mean(x)) / sd(x)}
zscore_all <- t(apply(normalized_counts, 1, cal_z_score))
zscore_subset <- zscore_all[top_genes,]
png("./plots/Heatmap_Zscores_plot.png", width = 1500, height = 1500, res = 300)
pheatmap(zscore_subset)
dev.off()
## 6. MA Plot
png("./plots/MA_plot.png", width = 1500, height = 1500, res = 300)
plotMA(dds)
dev.off()
### MA plot with removed noises
library(apeglm)
resLFC <- lfcShrink(dds, coef="condition_Disease_vs_Control", type="apeglm")
png("./plots/MA_plot_removed_noises.png", width = 1500, height = 1500, res = 300)
plotMA(resLFC)
dev.off()